Detailed slide-by-slide text content extracted from this presentation.
Slide 02
What Is an Ecosystem?
- An ecosystem is a community of living organisms interacting with each other and their physical environment as a functional unit. Energy flows through it; matter cycles within it. Every ecosystem is unique yet connected to all others.
- Energy (Sun)
- Producers
- Consumers
- Decomposers
- Abiotic Factors
- Nutrient Cycles
- 2 / 30
Slide 03
Major Biomes of Earth
- Tropical Rainforest
- Receives 2,000–4,000 mm of rain annually. Home to 50%+ of all species on 6% of land area. Amazon alone holds 390 billion trees.
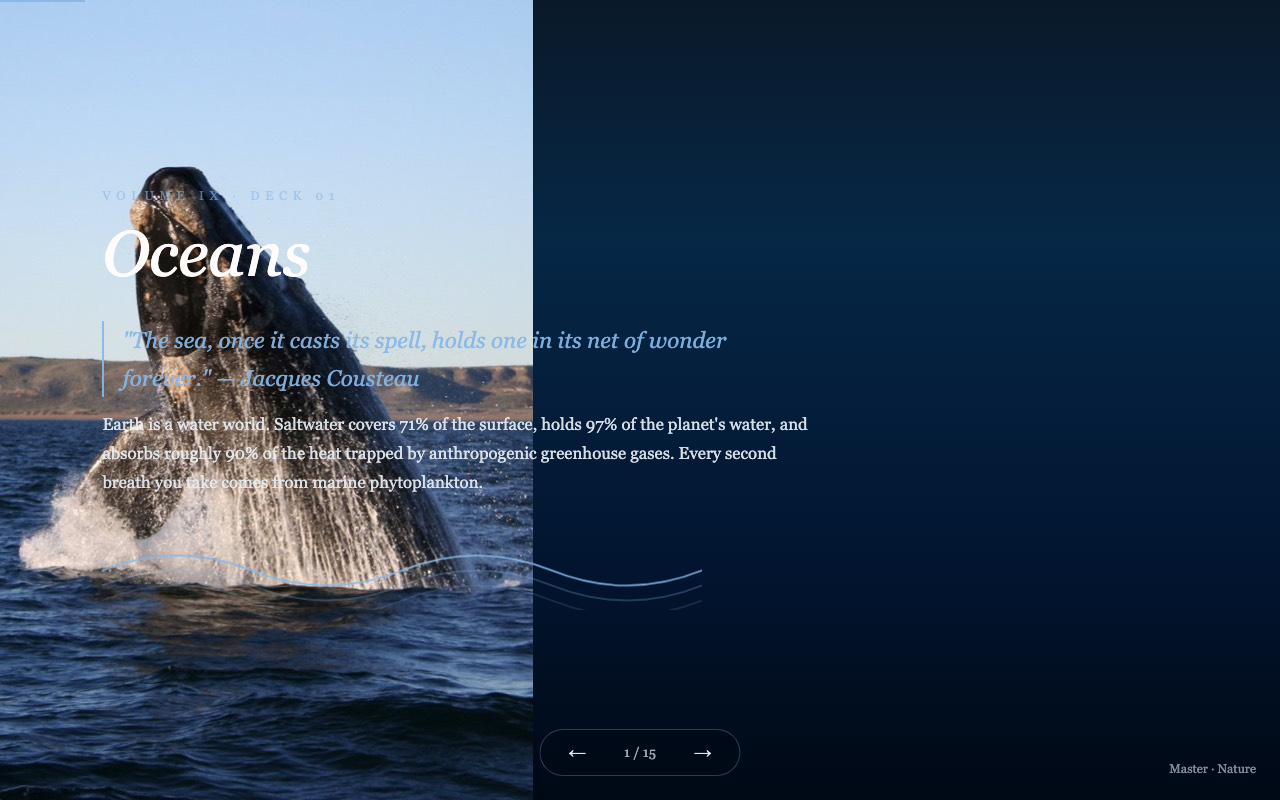
- Marine / Ocean
- Covers 71% of Earth's surface. Includes photic, twilight, and midnight zones. Supports 94% of Earth's living organisms by volume.
- Grassland / Savanna
- Seasonally dry, dominated by grasses. African savannas support the largest terrestrial animal migrations on the planet.
- Temperate Forest
- Deciduous and coniferous forests of mid-latitudes. High soil organic matter. Crucial carbon sinks in Europe, North America, and East Asia.
- Tundra
- Permafrost-dominated. Treeless, windy, -34°C to +12°C. Warming 4× faster than global average, releasing stored methane and CO₂.
- Desert
- Defined by aridity (under 250 mm/year), not temperature. Covers 33% of land. Surprising biodiversity adapted to extreme conditions.
- 3 / 30
Slide 04
Trophic Levels
- Producers (Autotrophs)
- Plants, algae, phytoplankton — convert solar energy to chemical energy via photosynthesis
- Primary Consumers (Herbivores)
- Insects, rabbits, wildebeest, zooplankton — eat producers directly
- Secondary Consumers (Omnivores/Carnivores)
- Frogs, small fish, foxes — eat primary consumers
- Tertiary Consumers (Apex Predators)
- Wolves, sharks, eagles — regulate populations of lower levels
- Decomposers (Saprotrophs)
- Fungi, bacteria, worms — break organic matter into inorganic nutrients, completing cycles
- 4 / 30
Slide 05
Nutrient Cycles
- Carbon Cycle
- Carbon moves between atmosphere, biosphere, and geosphere through photosynthesis, respiration, decomposition, combustion, and ocean exchange. Human activity adds 10 Gt C/year above natural flux.
- Nitrogen Cycle
- Nitrogen — essential for proteins and DNA — is fixed by bacteria, taken up by plants, returned to soil via decomposition, and released as N₂ by denitrifying bacteria. Fertilizers now double natural nitrogen fixation.
- Phosphorus Cycle
- Phosphorus has no gaseous phase — it moves from rock weathering to soil to organisms and back. Mining of phosphate rock is a one-way process; peak phosphorus threatens long-term agriculture.
- Water Cycle
- Evaporation, transpiration, condensation, precipitation, and runoff together move 577,000 km³ of water through the atmosphere annually. Forests drive transpiration in key rainfall zones globally.
- 5 / 30
Slide 06
Energy Flow: The 10% Rule
- Only about 10% of energy is transferred to the next trophic level — the rest is lost as heat through metabolic processes. This fundamental law shapes the structure of all ecosystems.
- 100%
- Solar energy captured by producers via photosynthesis at trophic level 1
- 10%
- Energy available to herbivores — 90% lost to plant respiration and heat
- Energy reaching tertiary consumers — why apex predators are always rare
- This thermodynamic limit explains why it takes vastly more land to produce meat than plants for the same caloric yield — and why plant-rich diets are more land- and energy-efficient at a global scale.
- 6 / 30
Slide 07
Ecosystem Services
- Provisioning Services
- Food, fresh water, timber, fiber, medicinal plants, and genetic resources — direct material benefits that humans extract from ecosystems. Worth trillions annually in global markets.
- Regulating Services
- Climate regulation, water purification, flood control, pollination, pest regulation, and disease control. These are the "invisible economy" — often unpriced but foundational to human civilization.
- Cultural Services
- Recreation, ecotourism, spiritual significance, scientific knowledge, and aesthetic value. Nature-based tourism alone generates $600 billion annually and supports 6% of global employment.
- Supporting Services
- Soil formation, nutrient cycling, primary production, and habitat provision — foundational processes that underpin all other ecosystem services. Timescales of decades to millennia to develop.
- 7 / 30
Slide 08
Ecological Succession
- Primary Succession
- Colonization of bare, lifeless substrate (lava flows, glacier retreat, sand dunes). Pioneer species like mosses and lichens begin soil formation; takes centuries to reach a climax community.
- Secondary Succession
- Recovery of a disturbed ecosystem where soil remains (after fire, flood, or land abandonment). Faster than primary — years to decades — because soil biology and seed banks persist.
- Climax Community
- A relatively stable community in equilibrium with its environment — the theoretical endpoint of succession. In practice, disturbance creates a shifting mosaic of successional stages.
- Pioneer Species
- First colonizers — nitrogen-fixing bacteria, lichens, fireweed — that tolerate harsh conditions and modify the environment to allow subsequent species to establish and thrive.
- Facilitation
- Early species make conditions better for later species (e.g., nitrogen fixers enriching soil for grasses, which then enable shrubs, then trees in forest succession).
- 8 / 30
Slide 09
Biodiversity Hotspots
- Concept & Criteria
- Norman Myers defined hotspots as regions with 1,500+ endemic vascular plant species AND having lost 70%+ of original habitat. Just 36 hotspots hold 60% of all plant, bird, mammal, reptile, and amphibian species.
- Indo-Burma
- One of the most threatened hotspots: rivers harbor extraordinary fish diversity; forests shelter tigers, elephants, and gibbons. Faces severe deforestation and hunting pressure across Southeast Asia.
- Mediterranean Basin
- Covers 22 countries; 22,500 endemic plant species. Only 5% of original vegetation remains. Threatened by agriculture, urbanization, fire, and climate-driven aridification.
- Mesoamerica
- Stretching from Mexico to Panama, this hotspot contains 7% of all species on 1% of Earth's land area — including 1,119 bird species and extraordinary salamander and snake diversity.
- 9 / 30
Slide 10
Ecological Disturbance
- Fire Regimes
- Many ecosystems evolved with fire: Australian eucalyptus forests, African savannas, and North American ponderosa pines all require periodic fire for nutrient cycling, germination, and succession control.
- Floods
- Floodplain inundation deposits nutrient-rich sediments, enables fish spawning in riparian areas, and maintains the mosaic of habitat types that support floodplain biodiversity.
- 🌪️
- Storms & Wind
- Windthrow creates canopy gaps in forests, allowing light to reach the understory and enabling regeneration of shade-intolerant species — maintaining forest structural diversity.
- Volcanic Activity
- Lava flows and ashfall create primary succession opportunities. Mount St. Helens' recovery (1980–present) has provided unparalleled data on ecosystem rebuilding from bare ground.
- Biological Disturbance
- Beavers alter entire watersheds by creating ponds. Elephants topple trees. Prairie dogs create habitat for burrowing owls. Organisms as engineers reshape their own ecosystems continuously.
- 10 / 30
Slide 11
Keystone Species & Trophic Cascades
- Sea Otters → Kelp Forests
- Sea otters eat urchins; without otters, urchins overgraze kelp, creating urchin barrens. One species controls the structure of an entire coastal ecosystem across thousands of kilometers.
- Wolves → Yellowstone Rivers
- Wolves reduced elk numbers and changed their grazing behavior, allowing riparian vegetation to recover, banks to stabilize, streams to narrow and deepen — altering the hydrology of entire river systems.
- Sharks → Seagrass Meadows
- Tiger sharks keep dugongs and turtles moving, preventing overgrazing of seagrass beds. Remove sharks and seagrass — a critical carbon sink and fish nursery — collapses under grazing pressure.
- Fig Trees → Tropical Forests
- Figs fruit year-round and feed hundreds of species during lean seasons. Called "keystone resources," their removal would cascade through the feeding relationships of entire tropical forests.
- 11 / 30
Slide 12
Ecosystem Threats
- Habitat Loss & Fragmentation
- The primary driver of species loss worldwide. When continuous habitat is divided into patches, populations become isolated, genetic diversity declines, and local extinction risk rises dramatically.
- Climate Change
- Species are shifting ranges, altering timing of migrations and blooms, and facing novel combinations of stressors. Ecosystems assembled over millennia are being restructured within decades.
- Nutrient Pollution
- Agricultural nitrogen and phosphorus runoff causes eutrophication — algal blooms deplete oxygen, creating dead zones. The Gulf of Mexico dead zone covers 15,000+ km² each summer.
- Invasive Species
- Non-native species can rapidly disrupt food webs, alter nutrient cycles, change fire regimes, and drive native species to extinction in the absence of co-evolved predators and competitors.
- 12 / 30
Slide 13
Marine Ecosystem Zones
- Sunlit Zone (0–200m)
- Photic zone where photosynthesis occurs. Home to phytoplankton, coral reefs, and most marine biodiversity. Produces ~50% of Earth's oxygen.
- Twilight Zone (200–1000m)
- Mesopelagic zone with faint light. Highest biomass of migrating organisms conducting daily vertical migrations of 500m+.
- 🕳️
- Midnight Zone (1000–4000m)
- Completely dark, high pressure, near-freezing. Organisms rely on marine snow — falling organic particles — from surface productivity above.
- Hydrothermal Vents
- Chemosynthetic ecosystems powered by sulfur rather than sunlight. Discovered in 1977 — revealed that life can exist without solar energy as a base.
- 🏝️
- Coral Reef
- Ocean's rainforests: 25% of marine species depend on reefs covering only 0.1% of the ocean floor. The most biodiverse marine ecosystem on Earth.
- Seagrass Meadows
- Critical fish nurseries and carbon sinks. Cover 300,000 km² globally and capture carbon 35× faster than tropical forests per hectare.
- 13 / 30
Slide 14
Soil: The Living Foundation
- A single teaspoon of healthy soil contains more organisms than there are people on Earth. Soil is not dirt — it is the planet's most complex and productive ecosystem, taking 500–1,000 years per centimeter to form.
- Soil Biology
- Bacteria, fungi, protozoa, nematodes, mites, earthworms, and arthropods form intricate food webs that cycle nutrients, build soil structure, and suppress disease.
- Mycorrhizal Networks
- Fungi connect 90% of plant species, transferring water, nutrients, and even chemical signals between trees — the "wood wide web" coordinating forest responses to stress.
- Soil Carbon
- Soils store 2.5× more carbon than all vegetation and 3× more than the atmosphere. Degraded soils release this carbon — making soil health a critical climate variable.
- Soil Degradation
- 33% of Earth's soils are degraded due to erosion, compaction, salinization, and chemical contamination. The UN estimates 10 million hectares of productive soil lost annually.
- 14 / 30
Slide 15
Freshwater Biomes
- Rivers & Streams
- Flowing water shaped by gradient, substrate, and seasonal flood pulses. Upper reaches are cold, oxygen-rich, and fast; lower reaches slow, warmer, and nutrient-rich.
- Lakes & Ponds
- Stratified into epilimnion, metalimnion, and hypolimnion. Turnover events in spring and fall mix nutrients. Home to 10% of all species and 25% of vertebrate diversity.
- Wetlands
- Marshes, swamps, bogs, and fens at the interface of aquatic and terrestrial worlds. The most productive ecosystems on Earth per unit area — and the most rapidly lost.
- Vernal Pools
- Seasonal pools that fill in winter, dry in summer. Isolated enough to evolve endemic species. Fairy shrimp, salamanders, and threatened wildflowers depend on their temporary existence.
- Underground Rivers
- Karst systems harbor unique blind, cave-adapted fauna — cave fish, crayfish, and amphipods that evolve in complete darkness. Highly sensitive to groundwater contamination.
- 15 / 30
Slide 16
Decomposers: Nature's Recyclers
- Fungi
- The primary decomposers of lignin (wood) — a task bacteria cannot perform efficiently. Without fungi, dead wood would accumulate indefinitely. Fungal networks permeate every teaspoon of forest soil.
- Bacteria
- Decompose soft organic matter at extraordinary speed. Nitrogen-fixing bacteria convert atmospheric N₂ into bioavailable ammonia, making them indispensable to plant nutrition globally.
- Detritivores
- Earthworms, millipedes, and woodlice physically fragment organic matter, increasing surface area for microbial action. Earthworms alone process 4–36 tonnes of soil per hectare annually.
- Scavengers
- Vultures, hyenas, and beetles remove carrion before it can spread disease. Vulture populations have collapsed in Asia and Africa, causing disease outbreaks — proving their ecosystem role.
- 16 / 30
Slide 17
The Water Cycle & Ecosystems
- Transpiration
- Plants transpire 70–80% of precipitation in tropical forests. The Amazon generates its own rainfall cycle — "flying rivers" carrying moisture from the Atlantic to the Andes, watering agriculture across South America.
- Watersheds
- Forest watersheds regulate river flow, filter contaminants, and moderate floods. New York City's protected Catskill watershed provides cleaner water than any filtration plant could at fraction the cost.
- Groundwater
- Aquifer recharge depends on natural land cover — permeable soils, wetlands, and forests allow infiltration. Paving and degradation reduce recharge, causing aquifer depletion globally.
- Coastal Systems
- Mangroves and salt marshes buffer storm surges, filter runoff, and store blue carbon. Their removal amplifies coastal flooding — infrastructure replacement costs run into billions per km of coast.
- 17 / 30
Slide 18
Ecosystem Feedback Loops
- Permafrost Thaw (Positive Feedback)
- Warming thaws permafrost → releases CO₂ and CH₄ → accelerates warming → thaws more permafrost. ~1.5 trillion tonnes of carbon locked in permafrost — more than in current atmosphere.
- Amazon Dieback (Positive Feedback)
- Deforestation reduces transpiration → less rainfall → more drought stress → more tree death → drier conditions. Scientists estimate a 20–25% deforestation tipping point; Amazon is currently at ~17%.
- Forest Growth (Negative Feedback)
- Higher CO₂ stimulates plant growth → more carbon absorbed → partially offsets emissions. However, this response saturates at high temperatures and is outpaced by current emission rates.
- Ocean Biological Pump (Negative Feedback)
- Phytoplankton bloom → absorb CO₂ → die and sink, carrying carbon to deep ocean. This biological pump sequesters ~10 Gt carbon/year and has operated for 3 billion years.
- Ice-Albedo (Positive Feedback)
- Sea ice melts → darker ocean absorbs more heat → more melting. Arctic warming is 4× faster than global average partly due to this amplifying loop already in motion.
- 18 / 30
Slide 19
Ecosystem Health Indicators
- Invertebrate Diversity
- Insects, worms, and crustaceans reflect habitat quality — sensitive to pollution, pesticides, and habitat change before vertebrates show stress.
- Amphibian Populations
- Amphibians breathe through permeable skin in both aquatic and terrestrial habitats — natural sentinels for water quality and ecosystem health.
- Water Clarity
- Turbidity, nutrient levels, and dissolved oxygen indicate eutrophication pressure, sedimentation, and the functioning of aquatic food webs.
- Bird Abundance
- Common bird indices like the Wild Bird Index track 3 billion birds lost in North America since 1970 — signaling ecosystem-wide insect and habitat decline.
- Plant Community Structure
- Native vs invasive plant ratios, age structure of forests, and canopy cover indicate ecosystem trajectory — recovering or degrading.
- Soil Microbiome
- Microbial diversity, respiration rates, and mycorrhizal colonization reveal below-ground ecosystem function — often the first indicator of agricultural intensification impacts.
- 19 / 30
Slide 20
Forest Ecosystems
- 4.06B
- hectares of forest globally — 31% of Earth's land area
- 60K+
- tree species identified worldwide (BGCI Global Tree Assessment)
- 80%
- of terrestrial biodiversity lives in forests
- Boreal Forest (Taiga)
- World's largest terrestrial biome, encircling the northern hemisphere. Dominated by conifers, stores vast quantities of soil carbon in peat and permafrost beneath conifer stands.
- Cloud Forests
- Shrouded in mist at altitude, these ecosystems capture water from clouds — some areas receive up to 2m of additional moisture not from rain. Extraordinarily high plant epiphyte diversity.
- Old-Growth vs Secondary
- Old-growth forests store more carbon, have greater structural complexity, and support more specialist species than secondary forests — yet only ~30% of forests remain old-growth globally.
- Canopy Science
- Forest canopies harbor an estimated 40% of all species. Canopy cranes and walkways have revealed entire ecosystems — including sunlit gardens, aerial carnivores, and aerial food webs — above the ground.
- 20 / 30
Slide 21
Tipping Points & Resilience
- 🌡️
- Ecological Resilience
- Resilience is an ecosystem's capacity to absorb disturbance and reorganize while undergoing change while essentially retaining the same function, structure, and feedbacks.
- Tipping Points
- Beyond a threshold of disturbance, an ecosystem shifts to an alternate stable state — and returning to the original state may require far more effort than crossing the threshold in the first place.
- Lake Eutrophication
- Clean lakes tip to turbid, algae-dominated systems when phosphorus loading exceeds a threshold. Even after phosphorus is removed, sediment release keeps lakes turbid for years or decades.
- Caribbean Reefs
- Coral-dominated reefs tipped to algae-dominated states when urchins died from disease in 1983, removing the primary grazer. Few reefs have recovered 40 years later — a textbook alternate state.
- Building Resilience
- Maintaining diverse species assemblages, reducing non-climate stressors, and protecting genetic diversity all increase an ecosystem's buffer zone before tipping — buying time for climate adaptation.
- 21 / 30
Slide 22
Ecosystem Restoration
- UN Decade on Restoration
- 2021–2030: the United Nations Decade on Ecosystem Restoration aims to restore 1 billion hectares of degraded land and 350 million hectares of degraded ocean habitat globally.
- Passive Restoration
- Simply removing the stressor — stopping grazing, hunting, or agriculture — allows natural regeneration. Costa Rica's forests doubled in cover from 21% to 52% in 40 years using passive methods.
- Active Restoration
- Replanting native species, reintroducing keystone fauna, removing invasives, and reconnecting fragmented habitats. The Loess Plateau in China transformed 35,000 km² of degraded land in 20 years.
- Assisted Natural Regeneration
- Protecting naturally regenerating seedlings from grazing and fire — cheaper than planting and can restore 1.4 billion hectares at fraction of active planting costs, with better long-term outcomes.
- 22 / 30
Slide 23
Grassland Ecosystems
- Grasslands and savannas cover ~40% of Earth's land area and store enormous quantities of carbon in their deep root systems — much of it hidden underground where it survives even fire and grazing.
- African Savanna
- Wildebeest migration moves 1.5 million animals across 2,900 km — the largest mammal migration on Earth, driven by rainfall and grass phenology.
- North American Prairie
- Once 169 million hectares; now only 1% remains. Deep root systems stored immense carbon — now released from cultivation over the past 150 years.
- Eurasian Steppe
- 8,000 km of grassland from Hungary to China, supporting saiga antelope, Przewalski's horses (reintroduced), and millions of migratory birds and raptors.
- Soil Carbon
- Grassland soils contain 34% of all terrestrial carbon stocks. Perennial grasses allocate up to 80% of biomass below ground — making them surprisingly powerful carbon stores.
- Fire Ecology
- Many grasslands require periodic fire to prevent shrub encroachment. Indigenous fire management maintained grassland diversity and productivity for thousands of years.
- Conversion Threat
- Grasslands are being converted to cropland faster than tropical forests and receive far less conservation attention — a major blind spot in global biodiversity strategy.
- 23 / 30
Slide 24
Polar & Alpine Ecosystems
- Arctic Tundra
- Treeless permafrost landscape warming 4× faster than the global average. As shrubs invade tundra, they trap snow and further warm the soil — a feedback loop already reshaping the Arctic.
- Antarctic Ice Ecosystem
- Antarctic krill underpin the entire Southern Ocean food web — whales, seals, and penguins all depend on krill, which themselves depend on sea ice algae for food and shelter during winter.
- Alpine Ecosystems
- Mountain biodiversity is distributed in vertical belts. Warming shifts species upslope by ~11 m/decade — but summit species have nowhere to go. Mountain endemics face a "summit trap."
- Cryosphere as Ecosystem
- Snow and ice are habitats: glaciers support ice algae, meltwater streams, and specialized invertebrates. The loss of glaciers eliminates downstream ecosystems that depend on summer meltwater flow.
- 24 / 30
Slide 25
Desert Ecosystems
- Life in Extreme Aridity
- Desert organisms have evolved extraordinary adaptations: cactus stomata open only at night; Namib fog beetles harvest atmospheric moisture; desert tortoises store water in their bladders.
- Biological Soil Crust
- Cryptobiotic crust — communities of cyanobacteria, fungi, and lichens — covers desert soils, fixing nitrogen, preventing erosion, and creating the foundation for desert plant establishment.
- Ephemeral Blooms
- Desert annual plants germinate only when moisture conditions are precisely right, then complete their entire lifecycle in days to weeks — flooding deserts with color after rare rain events.
- Desert Threats
- Off-road vehicles destroy biological crust that takes 50–250 years to recover. Solar energy development, overgrazing, and invasive grasses that carry fire are reshaping desert ecosystems rapidly.
- 25 / 30
Slide 26
Mangrove Ecosystems
- Coastal Guardians
- Mangroves reduce storm surge by 13–66% and wave heights by 50–70%. They protect 18 million people from flooding and provide $65 billion/year in flood protection services.
- Carbon Storage
- Mangroves store 3–5× more carbon per hectare than tropical forests. Their sediments accumulate carbon for millennia — making mangrove loss a significant but underreported climate issue.
- Nursery Habitat
- 80% of tropical fish species spend juvenile stages in mangroves. Their complex root systems protect young fish from predators, making mangroves foundational to coastal fisheries productivity.
- Rapid Loss
- 50% of global mangroves have been lost since 1950, primarily to aquaculture shrimp ponds in Southeast Asia. Current loss rate is 1–2% per year — one of the fastest losses of any biome.
- 26 / 30
Slide 27
Measuring Ecosystem Health
- Biodiversity Indices
- Shannon-Wiener diversity index, species richness, and functional diversity metrics quantify ecosystem complexity. More diverse ecosystems are generally more stable and productive.
- 🛰️
- Remote Sensing
- Satellite NDVI (Normalized Difference Vegetation Index) tracks vegetation greenness globally. Spectral signatures reveal ecosystem type, phenology, and disturbance in near-real-time.
- Biogeochemical Monitoring
- Soil respiration, carbon flux towers, and watershed chemistry reveal ecosystem metabolism — how fast energy and nutrients are cycling, and whether the system is gaining or losing carbon.
- Biological Indicators
- Macroinvertebrate assemblages, fish communities, and amphibian populations serve as reliable indicators of water quality and ecosystem integrity across multiple habitat types.
- Ecosystem Accounts
- The UN System of Environmental-Economic Accounting (SEEA EA) quantifies ecosystem extent, condition, and services in national statistics — making ecosystem health visible in economic decision-making.
- 27 / 30
Slide 28
Urban Ecosystems
- Urban Forests
- Trees reduce city temperatures by 2–8°C, cut energy use, filter 40–60% of particulates, and buffer stormwater — delivering $19–67 billion/year in US benefits alone.
- Urban Wildlife
- Cities support surprising biodiversity. London has 47 species of spider, 270 bird species, and populations of foxes, hedgehogs, and bats adapted to urban environments.
- Urban Hydrology
- Impervious surfaces increase runoff 5–10×. Green roofs, bioswales, and permeable paving restore infiltration, reducing flooding and recharging urban aquifers.
- Pollinator Corridors
- Garden networks and park systems create flight paths for bees and butterflies. Urban pollinators can achieve higher diversity than surrounding intensive agricultural areas.
- 🌡️
- Heat Island Effect
- Cities are 1–3°C warmer than rural surroundings. Strategic tree planting and green roofs in the hottest neighborhoods have the greatest impact on the most vulnerable urban populations.
- Evolution in Cities
- Urban environments drive rapid evolution: London Underground mosquitoes, darker-colored urban moths, and city-adapted coyotes show measurable genetic divergence from rural counterparts in decades.
- 28 / 30
Slide 29
The Future of Ecosystems
- Novel Ecosystems
- Human activity has created ecosystems with no historical analog — urban habitats, modified agricultural landscapes, and climate-shifted communities that may never return to pre-human baselines.
- Assisted Migration
- Moving species to track their climate envelope — intentionally or through conservation translocation — may be necessary for many species that cannot naturally migrate fast enough to survive climate change.
- Digital Twins
- High-resolution ecosystem models integrating satellite data, sensors, and AI are beginning to create "digital twins" of real ecosystems — enabling prediction of ecosystem responses before interventions are made.
- Planetary Stewardship
- Earth's life support systems are managed globally by 8 billion people acting locally. Governing commons — atmosphere, ocean, global biodiversity — remains the defining challenge of the Anthropocene.
- 29 / 30
Slide 30
Interconnected, Irreplaceable, Essential
- Every ecosystem on Earth is both a self-contained world and a thread in a planetary web. Understanding these systems — and our dependence on them — is the foundation for living sustainably on a finite planet.
- 8.7M
- estimated species on Earth
- $125T
- annual ecosystem services value
- 3B+
- years ecosystems have sustained complex life
- 10×
- restoration ROI versus habitat loss costs
- "The diversity of life on Earth is not a luxury. It is the foundation of human wellbeing, prosperity, and survival." — IPBES 2019
- 30 / 30