shipslides
Science16 slides0 views

Climate Science

A planet wrapped in a thin atmosphere, swallowing sunlight and radiating it back. The accounting is well understood; the consequences are accelerating.

StandaloneDownload
Sandboxed deck
Open raw

About this HTML presentation

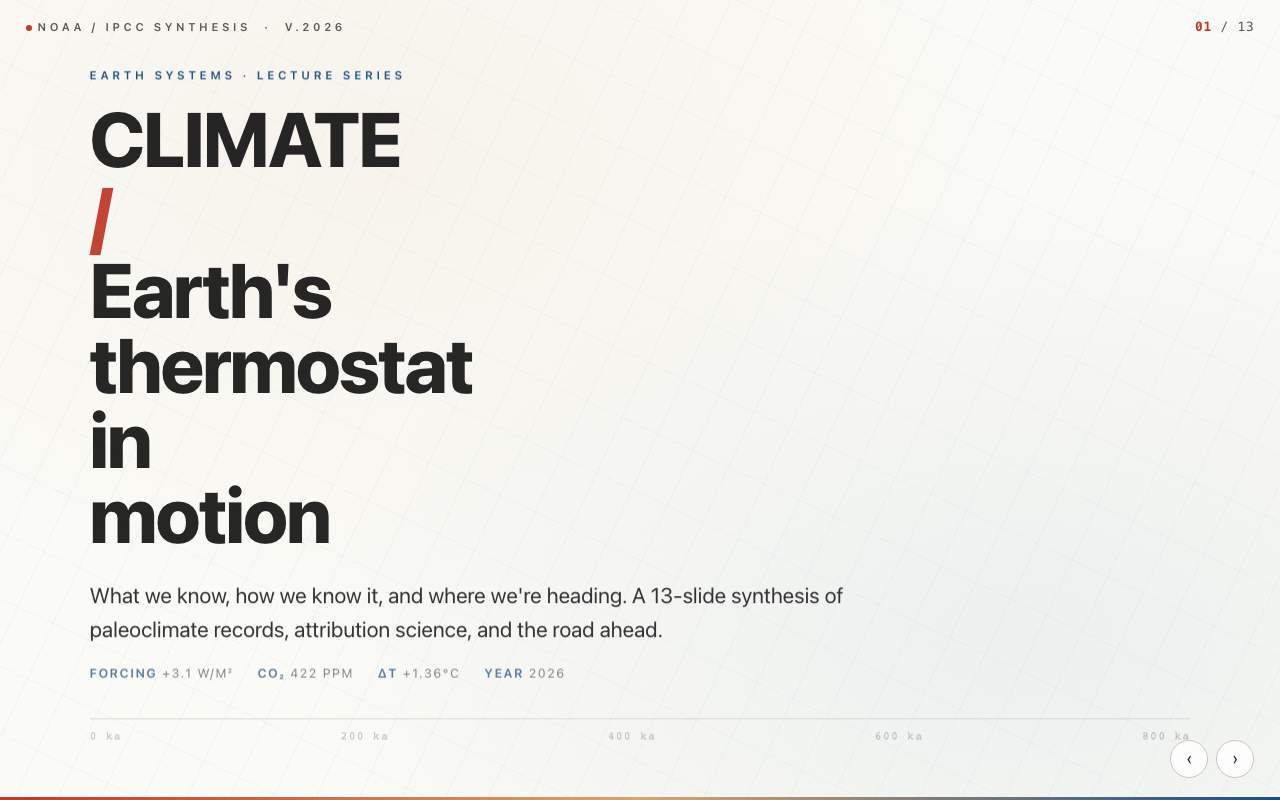
This Shipslides page presents Climate Science as an interactive HTML presentation deck in the Science catalog with 16 slides. The share page keeps the uploaded deck sandboxed while exposing readable context, topics, and a slide outline for viewers and search engines.

A planet wrapped in a thin atmosphere, swallowing sunlight and radiating it back. The accounting is well understood; the consequences are accelerating. Key sections include: Climate Science.; Earth's energy ledger.; The warming gases.; The last 800,000 years.; It's us.; The great heat sink.; Ice in retreat.; The model hierarchy.; Five futures.; Climate's discoverers..

Key sections

  • 01Climate Science.
  • 02Earth's energy ledger.
  • 03The warming gases.
  • 04The last 800,000 years.
  • 05It's us.
  • 06The great heat sink.
  • 07Ice in retreat.
  • 08The model hierarchy.
  • 09Five futures.
  • 10Climate's discoverers.
  • 11Two centuries of warning.
  • 12What changes.
  • 13The solution wedges.
  • 14What we still don't know.
  • 15Watch & read.

Topics covered

Slide outline
  1. 01Climate Science.
  2. 02Earth's energy ledger.
  3. 03The warming gases.
  4. 04The last 800,000 years.
  5. 05It's us.
  6. 06The great heat sink.
  7. 07Ice in retreat.
  8. 08The model hierarchy.
  9. 09Five futures.
  10. 10Climate's discoverers.
  11. 11Two centuries of warning.
  12. 12What changes.
  13. 13The solution wedges.
  14. 14What we still don't know.
  15. 15Watch & read.
Page data
Canonical
https://shipslides.com/d/science-climate-science
Category
Science
Size
357.9 KB
Updated
2026-05-17
LLM text
https://shipslides.com/d/science-climate-science/llms.txt

Presentation Transcript

Detailed slide-by-slide text content extracted from this presentation.

Slide 01

Earth's energy ledger.

  • P. 01 / 16 — Energy budget
  • The Sun delivers ~340 W/m² to the top of Earth's atmosphere, on average. About 30 % is reflected (clouds, ice, deserts) — the planetary albedo. The remainder, ~240 W/m², is absorbed and re-radiated as longwave infrared.
  • Greenhouse gases — H₂O, CO₂, CH₄, N₂O, O₃ — absorb a fraction of that outgoing radiation and re-emit it in all directions, including downward. Net effect: surface stays ~33 K warmer than it would otherwise.
  • S0(1 − α) / 4 = σ T4eff
  • Stefan–Boltzmann balance with no atmosphere: Teff = 254 K = −19 °C. With greenhouse: 288 K = 15 °C.
Slide 02

The warming gases.

  • P. 02 / 16 — Greenhouse Gases
  • CO₂424.6 ppm annual mean at Mauna Loa in 2024 (vs 280 ppm preindustrial). Lifetime: centuries-millennia. ~64 % of net forcing.
  • CH₄1.93 ppm. Lifetime ~12 yr. 28× CO₂ over 100 yr (GWP). ~17 % of net forcing.
  • N₂O336 ppb. Lifetime ~120 yr. GWP 273. ~6 % of forcing.
  • HalocarbonsCFCs, HFCs. Some GWPs > 10,000.
  • Water vapourLargest absolute contribution but a feedback, not a forcing — set by temperature.
  • O₃Stratospheric (good) vs tropospheric (warming, ~0.4 W/m²).
  • +1.36 °Cglobal warming, 2024 vs preindustrial
  • 426.9 ppmCO₂ — Mauna Loa monthly mean, May 2024
  • +3.7 W/m²forcing per CO₂ doubling
  • 2.5 – 4 °Cequilibrium climate sensitivity
Slide 03

The last 800,000 years.

  • P. 03 / 16 — Paleoclimate
  • Air bubbles in Antarctic ice (Vostok, EPICA, Dome C cores) preserve a direct sample of past atmospheres. CO₂ in the Pleistocene oscillated between 180 ppm (glacials) and 280 ppm (interglacials), driven by orbital pacing and amplified by ocean–carbon and ice-albedo feedbacks.
  • The Milankovitch cycles — eccentricity (100 kyr), obliquity (41 kyr), precession (23 kyr) — set the rhythm. The amplitude is the climate system responding.
  • We blew through the natural ceiling around 1950. CO₂ has not been this high in at least 3 million years (mid-Pliocene), when sea level was 15–25 m higher than today.
Slide 04

It's us.

  • P. 04 / 16 — Attribution
  • Three independent fingerprints converge on anthropogenic CO₂ as the main driver:
  • Isotopes. Fossil fuels are ¹⁴C-dead and ¹³C-depleted. Atmospheric δ¹³C is falling, exactly as expected.
  • O₂ depletion. Combustion consumes O₂; atmospheric O₂/N₂ is falling consistently with the carbon source.
  • Spectral. Outgoing longwave radiation has decreased in CO₂ absorption bands, while downwelling at the surface has increased.
  • IPCC AR6 (2021): "It is unequivocal that human influence has warmed the atmosphere, ocean and land."
  • Forcing decomposition (W/m²)
  • IPCC AR6 effective radiative forcings, 1750–2019.
Slide 05

The great heat sink.

  • P. 05 / 16 — Ocean
  • The ocean has absorbed ~91 % of the excess heat trapped by greenhouse gases since 1970, and ~26 % of anthropogenic CO₂. It is the planet's thermal flywheel.
  • Consequences: thermal expansion (~⅓ of observed sea-level rise), acidification (pH down ~0.1 unit), oxygen loss in many regions, slowing of the Atlantic Meridional Overturning Circulation, marine heatwaves of unprecedented intensity (e.g. North Atlantic 2023, Mediterranean 2022).
  • OHC trend~14 ZJ/yr (1.2 × 10²² J)
  • SLR rate (2024)4.5 mm/yr — accelerating
  • pH change−0.1 since 1850 = +30 % H⁺
  • O₂ loss~2 % since 1960
  • AMOC weakening~15 % since mid-20th c.
  • Coral bleachingGlobal event #4 declared April 2024
Slide 06

Ice in retreat.

  • P. 06 / 16 — Cryosphere
  • Greenland
  • Mass loss ~270 Gt/yr, 2002–23 (GRACE/GRACE-FO). 7.4 m of potential SLR locked up.
  • Antarctica
  • ~150 Gt/yr loss; West Antarctic Ice Sheet contains 4.3 m SLR; Thwaites & Pine Island glaciers vulnerable.
  • Arctic Sea Ice
  • September minimum: −13 % per decade. First ice-free summer plausible 2030s–40s.
  • Mountain Glaciers
  • ~270 Gt/yr; ~half of Hindu Kush Himalaya glaciers gone by 2100 in current path.
  • Permafrost
  • ~1,500 GtC stored. Thawing → CO₂ & CH₄ feedback. Yedoma especially carbon-rich.
  • Snow cover
  • Northern-hemisphere June extent down ~20 % since 1970. Cascading water-supply effects.
Slide 07

PLATE I

  • Glacial calving front. The cyanotype's natural subject — water in three states.
Slide 08

The model hierarchy.

  • P. 08 / 16 — Models
  • 0-D EBMs
  • Single-layer energy balance. T = ((1−α) S₀ / 4σε)^(1/4). On a postcard.
  • 1-D / 2-D
  • Latitudinal or vertical column models. Manabe–Wetherald (1967): radiative-convective with H₂O feedback.
  • GCMs
  • 3-D atmosphere/ocean general circulation models. ~25-100 km horizontal grid; primitive equations.
  • ESMs
  • Earth System Models: GCM + carbon cycle, dynamic vegetation, ice sheets, atmospheric chemistry.
  • CMIP6 (2019–) coordinates ~50 modeling groups. Hindcasts since 1850 reproduce the warming pattern only when anthropogenic forcing is included. Forecasts range from SSP1-1.9 (best case, ~1.5 °C peak) to SSP5-8.5 (~4.5 °C by 2100).
Slide 09

Five futures.

  • P. 09 / 16 — Scenarios
  • SSP1-1.9Net-zero CO₂ ~2050, peak 1.5 °C
  • SSP1-2.6Net-zero ~2070, ~1.8 °C
  • SSP2-4.5"Middle of the road", ~2.7 °C
  • SSP3-7.0Regional rivalry, ~3.6 °C
  • SSP5-8.5Fossil-fueled growth, ~4.4 °C
Slide 10

Climate's discoverers.

  • P. 10 / 16 — Key Figures
  • Joseph Fourier
  • 1768–1830. First to argue, 1824, that Earth's atmosphere acts as an insulator.
  • Eunice Foote
  • 1856. Showed CO₂ absorbs heat — predating Tyndall by 3 years.
  • John Tyndall
  • 1859. Quantified IR absorption of H₂O, CO₂, CH₄.
  • Svante Arrhenius
  • 1896. First quantitative climate sensitivity calc — ~5 °C per doubling.
  • Roger Revelle
  • 1957. "Geophysical experiment"; ocean uptake limits on CO₂.
  • Charles Keeling
  • 1958–. The Mauna Loa CO₂ curve.
  • Syukuro Manabe
  • 1967, 2021 Nobel. First reliable CO₂-doubling GCM.
  • James Hansen
  • 1988 testimony to U.S. Senate; raised public alarm.
Slide 11

Two centuries of warning.

  • P. 11 / 16 — Timeline
  • 1824Fourier proposes the greenhouse mechanism.
  • 1856Foote: "An atmosphere of [CO₂] would give to our earth a high temperature."
  • 1896Arrhenius computes ΔT for ×2 CO₂.
  • 1938Guy Callendar links CO₂ rise to observed warming.
  • 1958Keeling begins continuous CO₂ measurement at Mauna Loa.
  • 1979Charney Report: ECS = 1.5–4.5 °C.
  • 1988IPCC founded; Hansen testifies.
  • 1992UN Framework Convention on Climate Change (Rio).
  • 1997 / 2005Kyoto Protocol signed / enters force.
  • 2015Paris Agreement: hold < 2 °C, pursue 1.5 °C.
  • 2021IPCC AR6 WG1: human role unequivocal.
  • 2024First calendar year > 1.5 °C above preindustrial.
Slide 12

Slide 12

  • P. 12 / 16 — Pull Quote
  • "It is unequivocal that human influence has warmed the atmosphere, ocean and land."— IPCC AR6 WG1, Summary for Policymakers, 2021
Slide 13

What changes.

  • P. 13 / 16 — Impacts
  • Heatwaves
  • Frequency & intensity rise faster than the mean. Pacific NW 2021: +5σ event, attributed virtually impossible without warming.
  • Tropical cyclones
  • Frequency uncertain; intensity (Cat 4–5) and rainfall up. Slower translation = more flooding.
  • Drought & flood
  • Wet regions wetter, dry drier; extremes amplified. Western US "megadrought" 2000–22 worst in 1,200 yr.
  • Wildfire
  • VPD ↑, fire season ↑. 2023 Canadian fires emitted ~1,300 Tg CO₂ — > many countries.
  • Food & water
  • Crop yield projections −5 to −30 % by mid-century in tropics; adaptation partial.
  • Health
  • ~37 % heat-related deaths attributable to climate change (Lancet Countdown 2024).
Slide 14

The solution wedges.

  • P. 14 / 16 — Mitigation
  • Solar PV
  • Cost down 90 % since 2010. ~3 TW installed globally. Adds ~600 GW/yr.
  • Wind
  • Onshore + offshore. ~1 TW installed. LCOE competitive with gas.
  • Nuclear
  • ~10 % of global electricity. SMRs in development. Lifetime extensions.
  • Storage
  • Li-ion, sodium-ion, flow batteries, pumped hydro. Cost trajectory matches PV.
  • Electrification
  • Heat pumps, EVs. Doubles end-use efficiency typically.
  • CDR
  • Direct air capture, BECCS, biochar, ocean alkalinization. Needed at GtC scale by 2050.
  • Land use
  • Reforestation, soil carbon, regenerative agriculture, halt deforestation.
  • Methane
  • Leak detection (MethaneSAT 2024), agricultural feed additives, livestock improvements.
Slide 15

What we still don't know.

  • P. 15 / 16 — Open Questions
  • Q.01What is the equilibrium climate sensitivity to better than ±0.5 °C?
  • Q.02How do clouds, especially low marine stratocumulus, respond to warming?
  • Q.03Where are the tipping points (Greenland, AMOC, Amazon, permafrost) — and are some now committed?
  • Q.04Will the Antarctic ice sheet's marine instability go nonlinear, and on what timescale?
  • Q.05How do regional changes — monsoons, ENSO — evolve under different warming levels?
  • Q.06What is the safe and just operating space for the planet (Rockström et al.)?
  • Q.07Can solar radiation management ever be deployed responsibly?
Slide 16

Watch & read.

  • P. 16 / 16 — Go Deeper
  • MinutePhysics & Kurzgesagt — Climate Series
  • Plus PBS Terra "Weathered" for extreme-weather attribution stories.
  • Watch ↗
  • References
  • IPCCAR6 reports (WG1 2021, WG2 2022, WG3 2022)
  • PierrehumbertPrinciples of Planetary Climate (2010)
  • Wallace & HobbsAtmospheric Science
  • Hansen et al.numerous, on equilibrium sensitivity
  • Carbon Briefcarbonbrief.org — daily updates
  • Project Drawdowntechnology-by-technology mitigation atlas
Remove this deck