About this HTML presentation
This Shipslides page presents CLIMATE / Earth's thermostat in motion as an interactive HTML presentation deck in the Science catalog with 13 slides. The share page keeps the uploaded deck sandboxed while exposing readable context, topics, and a slide outline for viewers and search engines.
What we know, how we know it, and where we're heading. A 13-slide synthesis of paleoclimate records, attribution science, and the road ahead. Key sections include: CLIMATE / Earth's thermostat in motion; The greenhouse effect: certain molecules trap outgoing IR.; The records reach back 800,000 years.; The hockey stick: unmistakable since 1850.; Mauna Loa, since 1958: 280 → 422 ppm.; It's us. The fingerprints are unambiguous.; Doubling CO₂ buys us roughly 3°C of warming.; Tipping points: irreversible on human timescales.; Heat. Sea level. Drought + flood. Ecosystems under stress.; The cost curves already won the technical argument..
Key sections
- 01CLIMATE / Earth's thermostat in motion
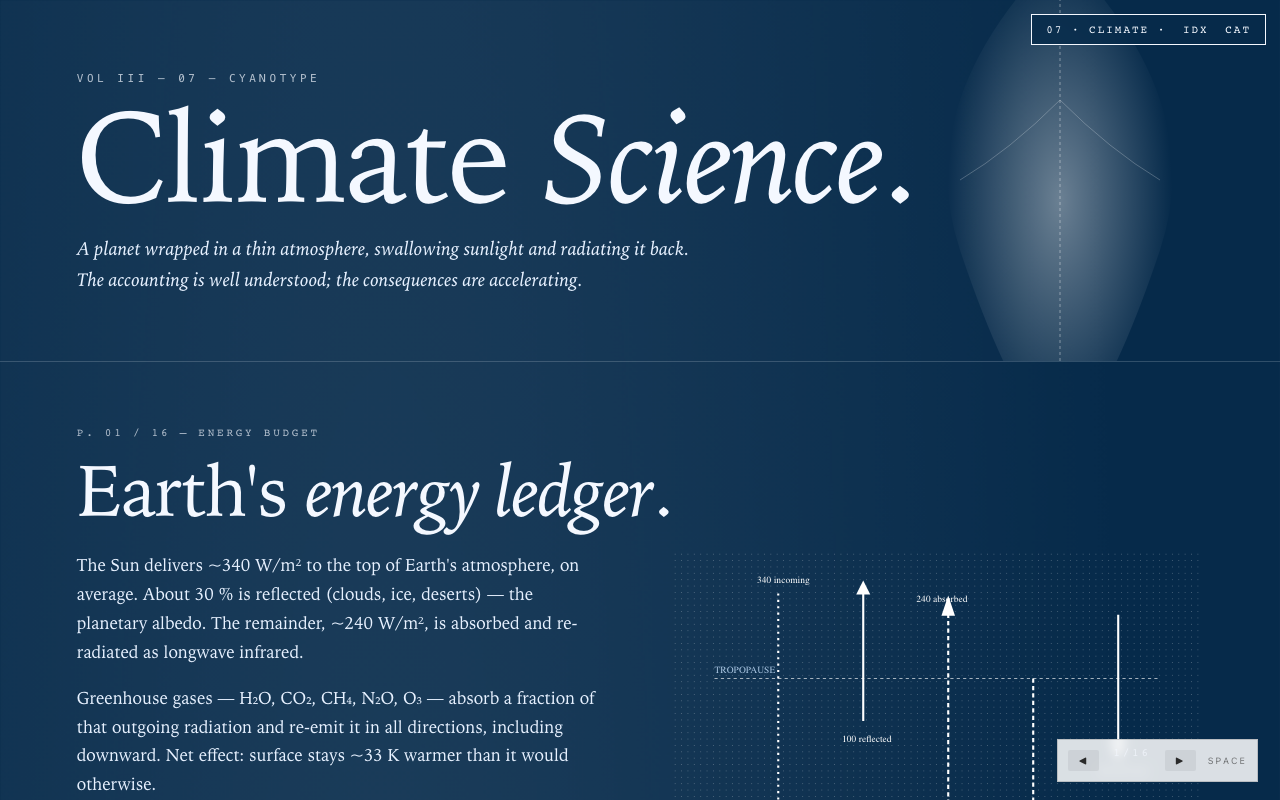
- 02The greenhouse effect: certain molecules trap outgoing IR.
- 03The records reach back 800,000 years.
- 04The hockey stick: unmistakable since 1850.
- 05Mauna Loa, since 1958: 280 → 422 ppm.
- 06It's us. The fingerprints are unambiguous.
- 07Doubling CO₂ buys us roughly 3°C of warming.
- 08Tipping points: irreversible on human timescales.
- 09Heat. Sea level. Drought + flood. Ecosystems under stress.
- 10The cost curves already won the technical argument.
- 11Some warming is already locked in.
- 121.5°C is nearly out of reach . 2°C is still defensible.
- 13Go deeper. Trust the data, follow the work.